Love impressing your pals with all there is to know about computer science? Or perhaps state geography is more your thing?
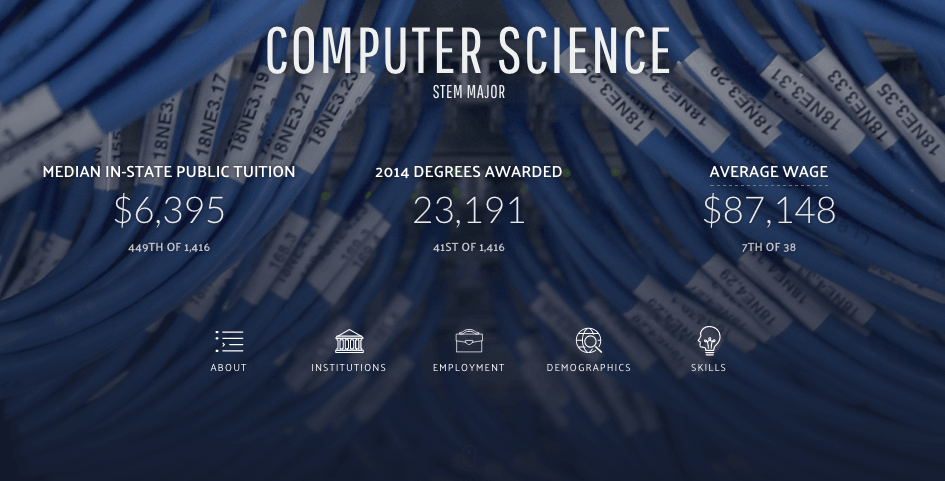
MIT Media Lab, in partnership with Deloitte and the data visualization startup Datawheel, has just gone live with perhaps the most extensive tool ever created for mining and visualizing US government open data, called Data USA.
A new era of tech events has begun
We’re back in New York this November for the 4th edition of our growth-focused technology event.
Type in ‘Texas’ and you’ll get everything from population size (27 million, #2 country-wide) to demographics, which all make for impressive visualization.
Where do people in Texas work?


The platform combines datasets from things like the US census, the Bureau of Labor Statistics and National Center for Education Statistics to reveal large-scale trends about the United States population.
The team behind it is already starting to tell stories using the data they’ve curated, including the fact that men still dominate in the highest paid industries or the close connection between diabetes and obesity.
The tools might change, but it seems some things are harder to budge.
Website seeks to make government data easier to view and understand on New York Times
: